Sentry를 활용한 에러 모니터링 및 트래킹
시작하며
안녕하세요. 데이블 Advertiser Platform 팀(AP팀)의 한갑종입니다. 이번 포스팅에서는 지난번 포스팅인 Express 상에서의 에러 핸들링에 이어 실제 발생한 에러를 어떻게 관리할 것인가에 대한 부분을 다루고 있습니다. 운영 중인 서버에서 에러가 발생하였을 때 이를 사람이 실시간으로 감시하고 있을 수 없으므로 이를 대신 감지해주고 필요시에 사람에게 알림을 줄 수 있는 모니터링 시스템의 중요성은 굳이 강조할 필요성이 없을 것 같은데요. 여기에 여러 서버에서 발생하는 에러를 모아 실시간으로 확인하고 에러를 분석할 수 있는 시스템까지 제공된다면 금상첨화겠죠.
Sentry
이 용도로 나와 있는 여러 가지 솔루션들이 있지만 Dable에서는 Sentry를 사용하고 있습니다. Sentry를 사용하게 된 계기에는 SaaS 형태로 큰 노력을 들이지 않고 사용이 가능한 점, 상대적으로 다른 APM 도구들에 비해서 가격이 저렴한 점이 있었던 것 같습니다. 사용하면서 Sentry만의 장점을 꼽아보자면 에러 분석에 특화되어 단순히 에러 하나하나를 보여주는 것이 아니라 연관된 에러들을 묶어서 하나로 보여주고, 이를 이용하여 사용자에게 보내는 알림을 세세한 레벨로 조정할 수 있다는 점을 꼽아볼 수 있을 것 같네요.
Sentry Setup
Sentry를 사용하기 위해서는 우선 Sentry에 가입이 필요한데요. Sentry는 가입 이후 간단한 에러 트래킹이나 모니터링 용도로 사용할 때 따로 요금을 하지 않는 Developer Plan을 제공하고 있습니다.
Express 서버에서의 에러 트래킹
가입 이후에 바로 프로젝트를 생성할 수 있는데요. 이번에 진행할 예제에서는 Node.js를 활용한 Express 서버를 사용할 예정이므로 Express를 선택한 뒤 프로젝트를 생성하면 예시 코드를 바로 보여줍니다.
아래 코드에서 Sentry를 세트업하고 두 개의 핸들러를 등록하는 부분이 항상 route의 최상단에, 에러 핸들러를 최종적으로 사용하는 공통 에러 처리 코드 바로 앞에 두는 것을 주의하면 좋습니다. 그 외에 tracesSampleRate는 성능 모니터링을 위해서 사용되는 부분이므로 production 코드에서는 요금제에 따라서 비율을 조정하거나 끌 필요가 있습니다.
import express from "express";
import * as Sentry from "@sentry/node";
import * as Tracing from "@sentry/tracing";

// or using CommonJS
// const express = require('express');
// const Sentry = require('@sentry/node');
// const Tracing = require("@sentry/tracing");

const app = express();

Sentry.init({
  dsn: "******",
  integrations: [
    // enable HTTP calls tracing
    new Sentry.Integrations.Http({ tracing: true }),
    // enable Express.js middleware tracing
    new Tracing.Integrations.Express({ app }),
  ],

  // Set tracesSampleRate to 1.0 to capture 100%
  // of transactions for performance monitoring.
  // We recommend adjusting this value in production
  tracesSampleRate: 1.0,
});

// RequestHandler creates a separate execution context using domains, so that every
// transaction/span/breadcrumb is attached to its own Hub instance
app.use(Sentry.Handlers.requestHandler());
// TracingHandler creates a trace for every incoming request
app.use(Sentry.Handlers.tracingHandler());

// All controllers should live here
app.get("/", function rootHandler(req, res) {
  res.end("Hello world!");
});

// The error handler must be before any other error middleware and after all controllers
app.use(Sentry.Handlers.errorHandler());

// Optional fallthrough error handler
app.use(function onError(err, req, res, next) {
  // The error id is attached to `res.sentry` to be returned
  // and optionally displayed to the user for support.
  res.statusCode = 500;
  res.end(res.sentry + "\n");
});

app.listen(3000);
위의 예제 코드를 활용하면 바로 서버를 띄운 뒤 에러 메시지를 테스트해볼 수 있습니다. 생성된 에러는 Sentry에서 바로 확인할 수 있습니다.
React에서의 에러 트래킹
Sentry를 사용할 때의 또 다른 장점 중 하나는 서버의 에러 외에 프론트엔드에서 발생한 에러도 잡을 수 있다는 점일 것 같습니다. 다만 이를 하나의 환경에서 분석하는 것은 불가능하고 두 개의 프로젝트로 별도로 관리하여야 합니다. 이번 예제로는 React를 활용하여 에러를 트래킹하는 기능을 살펴보려고 합니다. 위와 마찬가지 방식으로 프로젝트를 생성하면서 React를 선택하여 생성하면 마찬가지로 예제가 제시됩니다.
import React from "react";
import ReactDOM from "react-dom";
import * as Sentry from "@sentry/react";
import { Integrations } from "@sentry/tracing";
import App from "./App";

Sentry.init({
  dsn: "******",
  integrations: [new Integrations.BrowserTracing()],

  // Set tracesSampleRate to 1.0 to capture 100%
  // of transactions for performance monitoring.
  // We recommend adjusting this value in production
  tracesSampleRate: 1.0,
});

ReactDOM.render(<App />, document.getElementById("root"));

// Can also use with React Concurrent Mode
// ReactDOM.createRoot(document.getElementById('root')).render(<App />);
다만 위의 예제 코드는 React 관련 기본 설정 등이 포함되어 있지는 않은 코드이다 보니 create-react-app 등의 boilerplate를 활용하거나 별도로 설정을 진행하여야 합니다.
이번 포스팅에서는 아래 URL을 참고하여 Minimal React Application을 만들고 빌드를 수행하였습니다.
기본적으로 babel과 webpack을 이용하여 React를 위한 최소한의 bundling만을 수행한 뒤 빌드를 진행하게 됩니다.
https://levelup.gitconnected.com/how-to-setup-a-react-application-with-webpack-f781b5c4a4ab
또한 Sentry에서 코드 단위 분석이 가능하게 하려면 sourcemap을 생성하여 Sentry로 해당 sourcemap의 upload를 수행하도록 webpack의 옵션을 조정하여야 합니다. 최종적으로 만들어지는 bundling 용 webpack의 샘플 코드는 아래와 같습니다. 아래의 authToken은 Sentry 웹페이지에서 발급받을 수 있으며, release 값은 빌드할 때마다 인자로 받아서 수정하는 것이 권장됩니다.
const webpack = require('webpack');
const SentryWebpackPlugin = require("@sentry/webpack-plugin");

module.exports = {
  mode: 'production',
  // other webpack configuration
  devtool: 'source-map',
  entry: './react.js',
  output: { filename: 'app.js' },
  module: {
    rules: [
      {
        test: /\.(js|jsx)$/,
        exclude: /node_modules/,
        use: {
          loader: "babel-loader",
          options: {
            presets: ["@babel/preset-env", "@babel/preset-react"],
          },
        },
      },
    ],
  },
  plugins: [
    new SentryWebpackPlugin({
      // sentry-cli configuration - can also be done directly through sentry-cli
      // see https://docs.sentry.io/product/cli/configuration/ for details
      authToken: "******",
      org: "org-name",
      project: "react-test",
      release: "HEAD",
      // other SentryWebpackPlugin configuration
      include: ".",
      ignore: ["node_modules", "webpack.config.js"],
      dryRun: false,
    }),
  ],
};
서버단 트래킹과 프론트엔드단 트래킹이 합쳐진 최종 샘플 코드
위의 webpack을 수행하게 되는 대상인 react 파일은 에러 트래킹만을 위한 코드이므로 간략화하여 하나의 파일에 담아두었습니다. 프론트엔드 단의 Sentry 코드에서 주의할 점은 서버 단과 다르게 integration에서 다른 플러그인을 활성화하는 것, 실제 프론트엔드 단 코드가 실행되는 지점에 같이 bundling이 되어야 한다는 점이 있을 것 같네요.
import React from "react";
import ReactDOM from "react-dom";
import { BrowserRouter, Route } from 'react-router-dom';
import * as Sentry from "@sentry/react";
import { Integrations } from "@sentry/tracing";

Sentry.init({
  dsn: "******",
  integrations: [new Integrations.BrowserTracing()],

  // Set tracesSampleRate to 1.0 to capture 100%
  // of transactions for performance monitoring.
  // We recommend adjusting this value in production
  tracesSampleRate: 1.0,
});

const Home = () => {
  return (
    <div>
      Hello React!
    </div>
  )
}

const DebugReact = (props) => {
  return (
    <div>
      Hello {props.name}
      <button onClick={methodDoesNotExist}>Break the world</button>
    </div>
  );
}

const App = () => {
  return (
    <BrowserRouter>
      <Route exact path="/react" component={Home}/>
      <Route path="/debug-react" component={DebugReact}/>
    </BrowserRouter>
  );
}

ReactDOM.render(<App />, document.getElementById("root"));
아래 코드는 위의 routing 하는 코드 및 Express 에러 트래킹을 위한 코드를 합친 샘플 코드입니다.
맨 처음의 코드에서 react를 위한 설정이 추가되고, 이전 에러 핸들링 포스팅에 나왔었던 express-async-errors를 활용한 공통 에러 핸들링 코드가 추가되어 있습니다.
서버 단의 에러 트래킹 코드에서는 바로 error를 Throw 하거나, Promise를 활용한 상황에서의 처리를 확인할 수 있습니다.
그 외에 에러를 명시적으로 try-catch 하는 경우 Sentry.captureException 이나 Sentry.captureMessage 등을 활용하여 원하는 Error를 Sentry로 전송하는 것도 가능합니다.
const express = require('express');
const Sentry = require('@sentry/node');
const Tracing = require("@sentry/tracing");

require('express-async-errors');

const app = express();

// noinspection JSCheckFunctionSignatures
Sentry.init({
  dsn: "https://9a229fb3851d4752ab9d3be939512ea6@o1002481.ingest.sentry.io/5962851",
  integrations: [
    // enable HTTP calls tracing
    // new Sentry.Integrations.Http({ tracing: true }),
    // enable Express.js middleware tracing
    new Tracing.Integrations.Express({ app }),
  ],

  // Set tracesSampleRate to 1.0 to capture 100%
  // of transactions for performance monitoring.
  // We recommend adjusting this value in production
  tracesSampleRate: 1.0,
});

// RequestHandler creates a separate execution context using domains, so that every
// transaction/span/breadcrumb is attached to its own Hub instance
app.use(Sentry.Handlers.requestHandler());
// TracingHandler creates a trace for every incoming request
app.use(Sentry.Handlers.tracingHandler());

app.use(express.static('./dist'));

// All controllers should live here
app.get("/", (req, res) => {
  res.send("Hello world!");
});

app.get("/debug-sentry", () => {
  throw new Error("My first Sentry error!");
});

const RejectedPromise = async () => {
  return Promise.reject('test reject');
}

app.get("/debug-next", async (req, res, next) => {
  return RejectedPromise()
  .then(() => {
    res.send("Success");
  })
  .catch((err) => {
    next(err);
  })
});

app.get("/debug-manual", (req, res) => {
  try {
    // noinspection ExceptionCaughtLocallyJS
    throw new Error("Manual Sentry error");
  } catch (err) {
    Sentry.captureException(err);
  }
  res.send("Normal Result");
});

const resultStr = `<html lang="ko">
<head>
  <title></title>
</head>
<body>
  <div id="root"></div>
  <!--suppress HtmlUnknownTarget -->
<script src="app.js"></script>
</body>
</html>`;

app.get("/react", (req, res) => {
  res.send(resultStr);
})

app.get("/debug-react", (req, res) => {
  res.send(resultStr);
})

app.get('/favicon.ico', (req, res) => res.status(204));

// The error handler must be before any other error middleware and after all controllers
app.use(Sentry.Handlers.errorHandler());

// Optional fallthrough error handler
app.use((err, req, res, next) => {
  // The error id is attached to `res.sentry` to be returned
  // and optionally displayed to the user for support.
  // noinspection JSUnresolvedFunction,JSUnresolvedVariable
  res.send(res.sentry + "\n");
});

app.listen(8081);
위의 코드에서는 react 용의 프론트엔드 코드를 별도의 파일로 분리하지 않기 위해서 문자열을 활용하여 HTML 코드를 대체하여 결과 페이지를 렌더링하는 데 사용하고 있습니다. 참고로 8081번 포트를 활용하고 있는 이유는 실제 프론트엔드 단의 에러를 정상적으로 트래킹하기 위해서는 bundling 된 파일에 접근할 수 있어야 하는데 이를 위해서 local 환경이 아니라 AWS의 ElasticBeanstalk를 활용하여 서버를 띄워뒀기 때문입니다.
Sentry를 사용한 Error Tracking
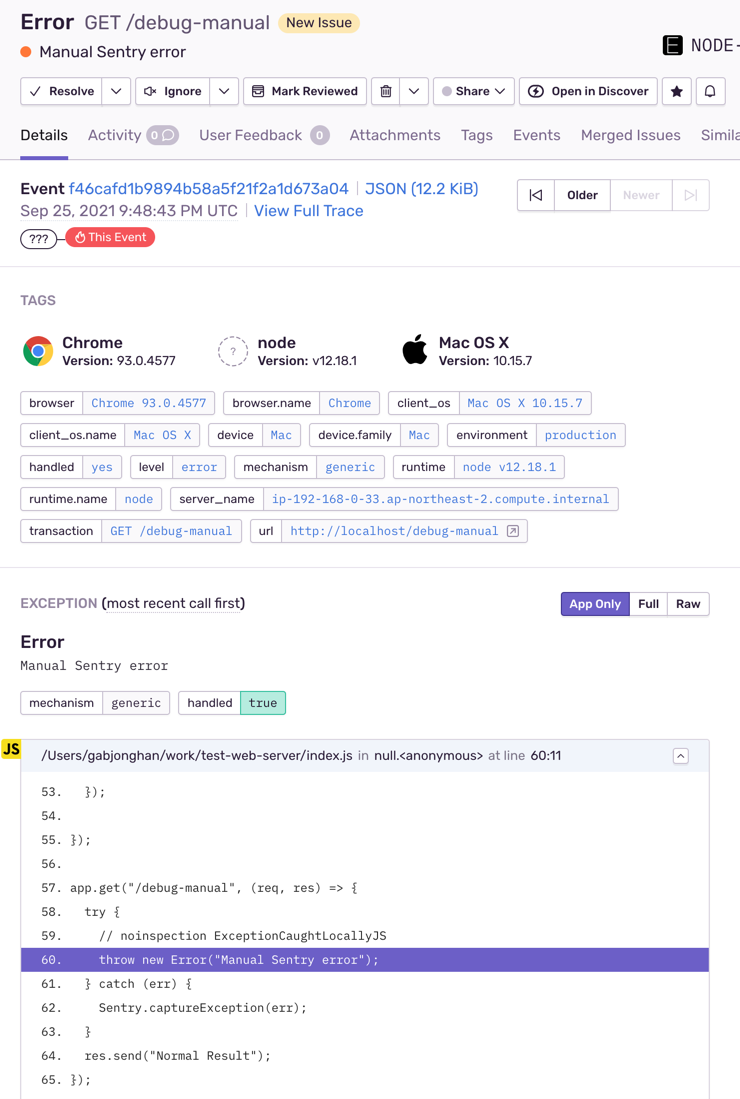
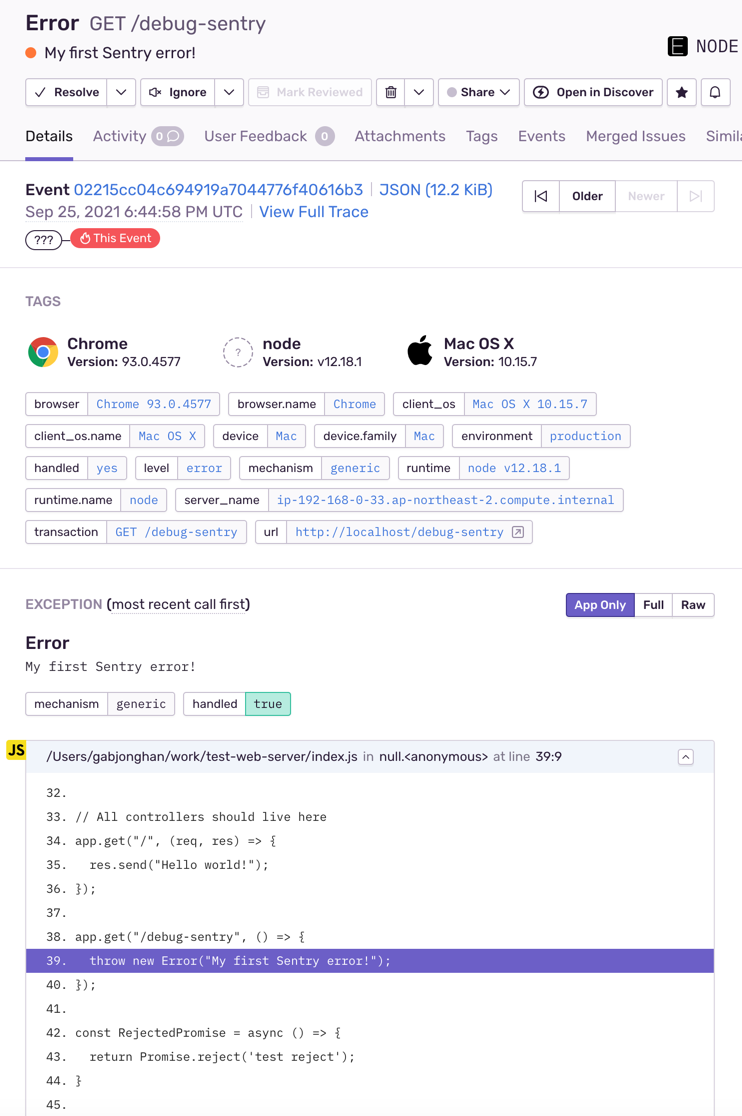
위에서 언급한 것처럼 실제로 띄워둔 AWS 상의 서버 주소에 접근하여 Sentry에 전송된 Error를 확인해봅시다. Express로 만들어진 프로젝트에서 이슈들을 확인해보면 아래와 같이 유사한 에러가 묶여 있는 것을 목록에서 확인할 수 있습니다.
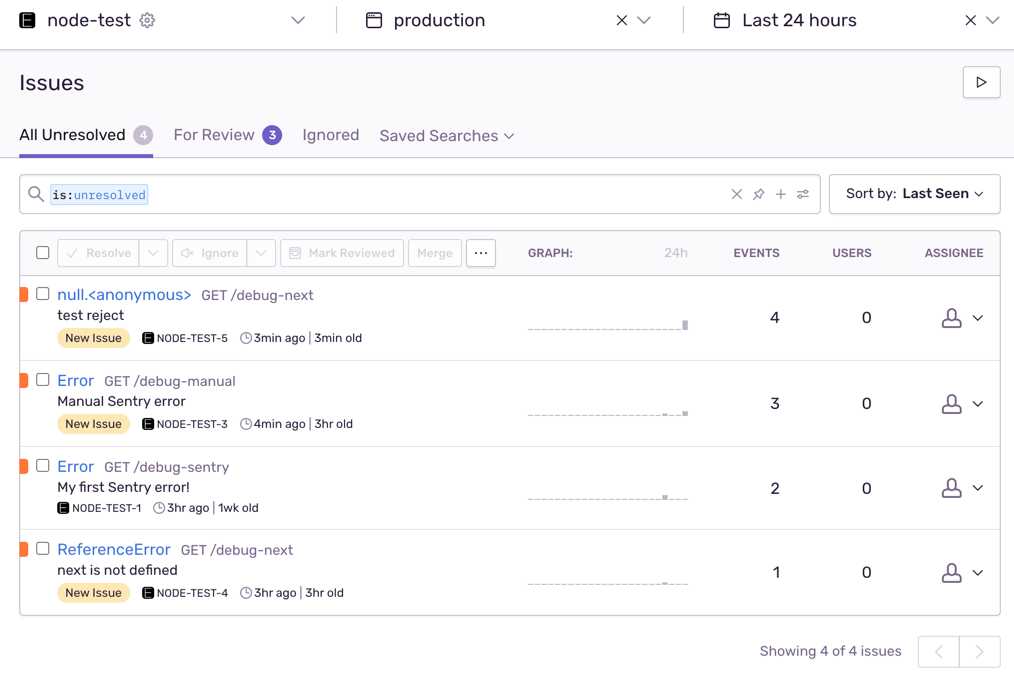
실제 에러를 클릭해서 들어가 보면 발생한 시각, 시스템에 대한 정보, 그리고 실제 발생한 에러와 추정되는 에러 발생 위치까지 자세히 나와 있는 모습을 볼 수 있습니다. HTTP 요청의 URL 및 사용 파라미터 등의 자세한 정보도 확인할 수 있으므로 굉장히 유용하게 사용할 수 있습니다.
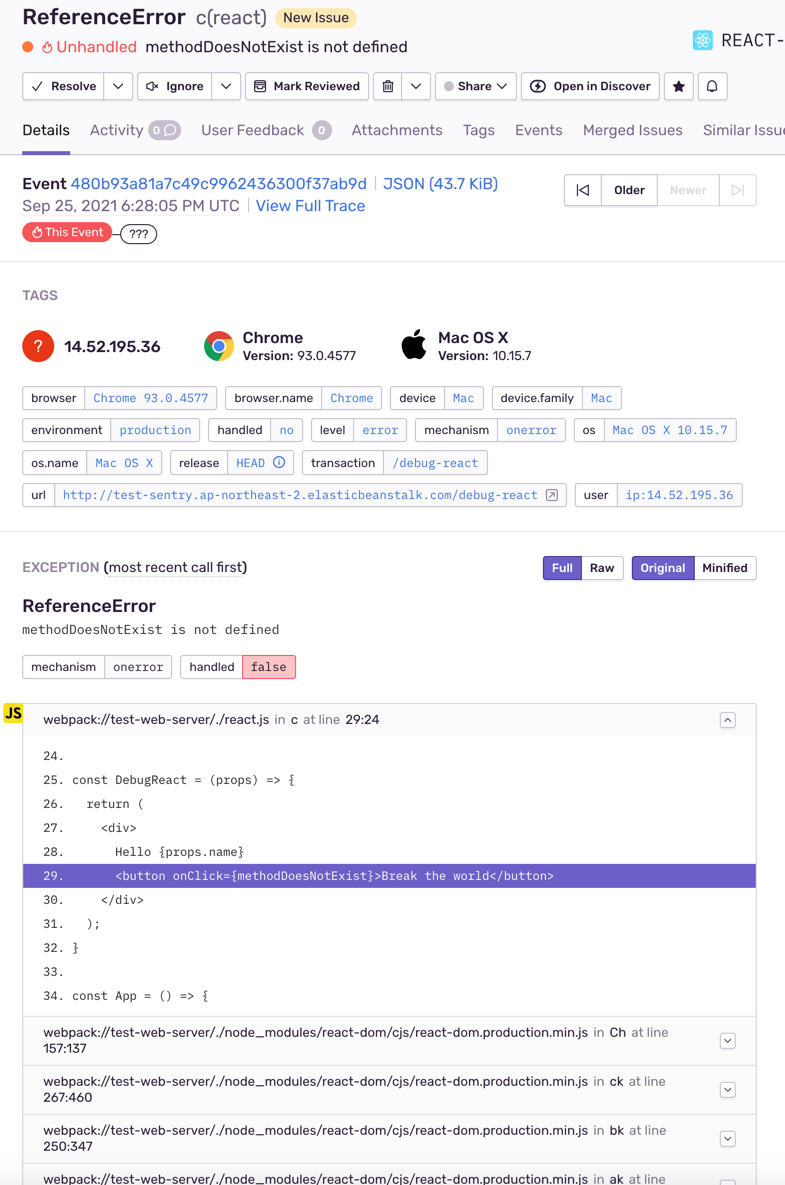
React 용의 프로젝트에서 이슈를 클릭해봐도 마찬가지로 코드 레벨에 대한 자세한 정보를 얻을 수 있음을 확인할 수 있습니다. 다만, 코드 정보를 얻기 위해서는 로컬환경이 아닌 실제 동작하는 환경에서의 번들링 된 코드와 이를 실제 코드와 연결해주기 위한 소스 맵이 업로드되어있어야 합니다.
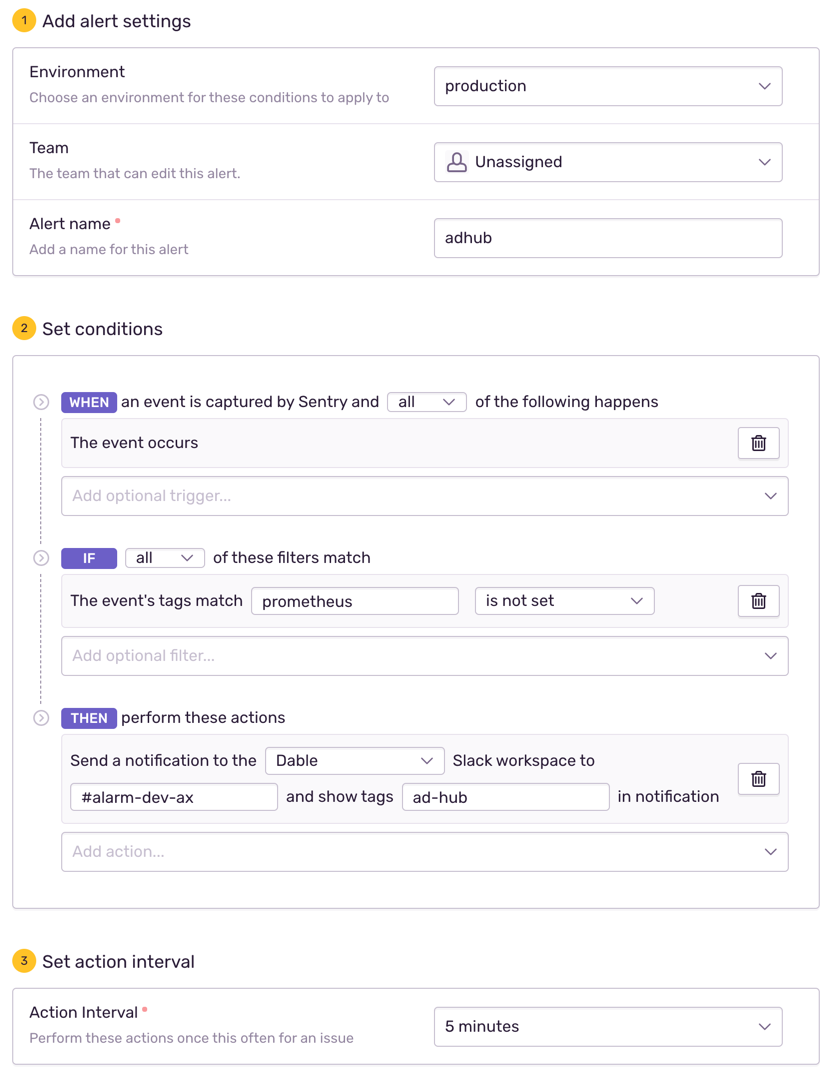
Sentry를 사용한 Error Monitoring
에러 모니터링과 알림을 위해서는 Alert 창에서 규칙을 생성하면 됩니다. 알림 생성 버튼을 누르게 되면 프로젝트별로 특정 조건에 따라서 알림을 보낼 수 있게 설정하게 됩니다. Sentry에서는 알림 조건에 해당할 때 notification을 Slack을 통해서 보낼 수 있도록 Integration을 지원하는 데 이를 사용하려면 유료 결제가 필요합니다.
아래는 데이블에서 사용하는 실제 예입니다. 5분 동안 특정 프로젝트에서 에러가 한 건이라도 발생하면 특정 채널로 알림을 보내게 되어 있습니다.
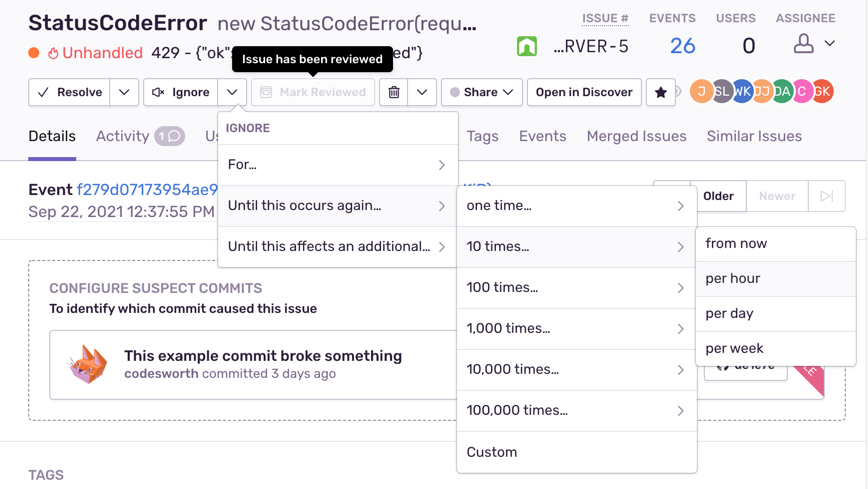
이러한 모니터링을 활용하여 에러에 대한 빠른 알림을 받아보게 되는데 여기서 이슈별로 알림에 대한 추가 설정을 활용하게 되면 좀 더 활용하기 편해집니다. 아래는 실제로 특정 이슈에서 알림을 조건에 따라서 ignore 처리하여 세세하게 조정하는 예시입니다.
맺으며
이렇게 Sentry를 활용하여 에러를 트래킹하고 트래킹된 에러를 모니터링하여 알림을 보내는 과정을 살펴보았습니다. 지금까지 사용해온 Sentry의 장점이라면 가볍게 사용할 수 있으면서도 에러를 직관적으로 분석해주며, 쉬운 알림 설정을 통해서 문제가 생겼을 때 금방 파악하고 처리할 수 있다는 점이 있을 것 같네요. 특히나 이렇게 발견된 에러를 줄여나가면 나갈수록 지급해야 하는 비용이 줄어든다는 점에서 관리자로서 매력적인 도구인 것 같습니다. 여러분도 Sentry와 같은 툴을 사용해서 코드 퀄리티를 높여 나가면 좋을 것 같다는 말씀을 드리면서 마무리하겠습니다.